
An onsite generator is a capital purchase that replaces a recurring cost. Whether it pays back — and how quickly — depends almost entirely on what you spend today and how much of that spend the generator can replace. This page sets out how to build that comparison honestly, with a simple model you can run on your own numbers.
About claims on this page
EcoloxTech generators produce a hypochlorous acid solution on site. They are not EPA-registered disinfectants and we make no efficacy claims for them or for the solution they produce. The only EcoloxTech product with disinfection claims is HOCl-AS200 (EPA Reg. No. 101112-1), used according to its label. Research cited here describes published studies of hypochlorous acid and electrolysed water; it is not a claim for any product.
The principle
Buying sanitation chemicals is an operating cost that never ends: every drum or case is paid for, shipped, stored and diluted, and then it is gone. Generating hypochlorous acid on site is mostly a fixed cost: the system and its installation, plus relatively small running costs for salt, water, electricity, filters and service. Payback is the point at which the running savings have covered the fixed cost.
What to count today
Pull twelve months of invoices and add up what you actually spend on the chemistry a generator could replace. Then add the costs that do not appear on the chemical invoice:
| Cost | Where to find it |
|---|---|
| Sanitation chemicals the generator can replace | Supplier invoices, 12 months |
| Freight and delivery charges | Invoices; often a separate line |
| Storage space for concentrate | Floor area × your cost per square foot |
| Labour for receiving, stock-checking and dilution | Minutes per day × loaded labour rate |
| Dosing equipment, dispensers and their service | Maintenance records, rental agreements |
| PPE and spill kits for concentrate handling | Consumables spend |
| Waste and container disposal | Waste contracts |
| Dilution errors and rework | Harder to measure; note incidents |
Leave out anything the generator will not replace — detergents, and any product you must keep because a task needs specific registered label claims.
What to count with a generator
| Cost | Notes |
|---|---|
| System purchase | EcoloxTech 300 list price $9,999; EcoloxTech 1200 $39,999; Micro $55.99 |
| Installation | Quoted per site; standard installation kits available (e.g. E1200 kit) |
| Storage and distribution | Holding tank, float switch, pumps and outlets where needed |
| Salt or brine | Food-grade salt or ready-to-use brine |
| Water and electricity | At your utility rates |
| Filters and service | Sediment cartridges and periodic service parts |
| Testing | Test strips or photometer for daily verification |
A simple payback model
Three numbers do the work:
- A = annual cost today that the generator replaces (chemicals plus the hidden costs above).
- B = annual running cost with the generator (salt, water, power, filters, service, testing).
- C = one-off cost (system, installation, storage and distribution).
Annual saving = A − B
Payback (years) = C ÷ (A − B)
5-year net saving = 5 × (A − B) − C
If A is not comfortably larger than B, a generator is not the right answer for that site, and we will tell you so.
An illustrative worked example
The figures below are hypothetical, chosen only to show how the model works. Your audit uses your invoices and your utility rates.
| Line | Illustrative figure |
|---|---|
| A — chemicals the system replaces | $14,000 / year |
| A — freight, storage, dilution labour, dispensers | $4,000 / year |
| A total | $18,000 / year |
| B — salt or brine, water, electricity | $2,500 / year |
| B — filters, service, testing | $1,500 / year |
| B total | $4,000 / year |
| C — EcoloxTech 300, installation, tank and distribution | $16,000 one-off |
| Annual saving (A − B) | $14,000 |
| Payback (C ÷ saving) | about 1.1 years |
| 5-year net saving | about $54,000 |
Change any input and the result changes. A small site spending a few thousand dollars a year may find a ready-to-use product more economical than a system; a plant spending six figures may justify a larger system with storage.
A real example: Norwegian Cruise Line
EcoloxTech has worked with Norwegian Cruise Line Holdings (NCLH) since 2016, and EcoloxTech E-300 generators have been installed fleetwide since 2020. The full deployment story — what it replaced, what it cost and the trade an operator makes in exchange — is in the Norwegian Cruise Line case study. Applying the model above to that fleet gives the following, using EcoloxTech cruise-line cost data for a 4,266-guest reference ship, scaled per berth.
| Hypochlorous acid | One ship 4,266 guests |
NCL fleet 21 ships, 63,300 berths |
NCLH fleet 34 ships, 71,300 berths |
|---|---|---|---|
| Sanitation spend today (A)* | $285,000 | $4.23M | $4.76M |
| After installation (B) | $1,400 | $20,800 | $23,400 |
| Net saving per year | $283,600 | $4.21M | $4.74M |
| Equipment, one time (C) | $130,000 | $1.93M | $2.17M |
| Payback | about 5.5 months | about 5.5 months | about 5.5 months |
| Net over five years | $1.29M | $19.1M | $21.5M |
In the terms of the model, per ship: A = $285,000, B = $1,400 and C = $130,000. The annual saving is $283,600, payback is $130,000 ÷ $283,600 ≈ 0.46 years (about 5.5 months), and the five-year net saving is 5 × $283,600 − $130,000 ≈ $1.29 million.
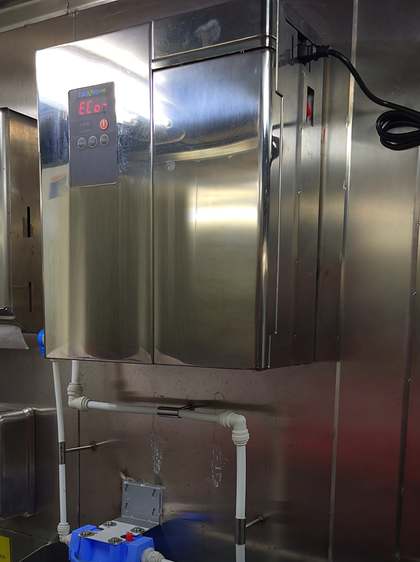
A cruise ship sits at the high end of the range. Sanitation runs around the clock, and every drum of chemical has to be loaded in port, stored in limited space aboard and, where it is hazardous, landed again for disposal — costs that the spend figure above does not even include. The E-300 used is compact (32 × 17 × 42 cm, 11.8 kg), built in 316 stainless steel, wall- or bench-mounted, runs on 100–240 V at 180 W and produces up to 300 L/hr. Most land-based sites spend less than a ship; the model works the same way on their numbers.
How sensitive is payback?
Using the same illustrative one-off cost of $16,000 and running cost of $4,000 a year, payback moves sharply with what a site spends today:
| Annual cost replaced (A) | Annual saving (A − B) | Payback | 5-year net |
|---|---|---|---|
| $6,000 | $2,000 | 8 years | −$6,000 |
| $10,000 | $6,000 | about 2.7 years | $14,000 |
| $18,000 | $14,000 | about 1.1 years | $54,000 |
| $30,000 | $26,000 | about 7 months | $114,000 |
The lesson is simple: at low spend, a generator may not pay back within a sensible horizon; at moderate and high spend, it usually becomes a question of how to size and install it rather than whether.
Data to gather before you run the numbers
- Twelve months of sanitation chemical invoices, with product names and volumes.
- Freight, delivery and dispenser rental charges.
- Your task list: area, method, volume per use, frequency.
- Staff time spent receiving, storing and diluting chemicals.
- Utility rates for water and electricity.
- Photos or notes of the likely install location, water supply, drainage and power.
- Any tasks that must stay on a specific registered product.
Multi-site operators
Restaurant groups, school districts, hotel groups and multi-plant processors can run the model per site and then look at the portfolio: sites with the highest spend usually justify a system first, while low-volume sites may be better served by countertop units or ready-to-use product. Standardising SOPs, test logs and training across sites is often worth as much as the chemical saving itself.
Savings and costs that are easy to miss
- Space. Concentrate storage becomes available for other uses.
- Handling. Less receiving, decanting and dilution, and no concentrate on the floor.
- Consistency. Solution produced at a set concentration rather than mixed by hand.
- Price exposure. Chemical prices and freight rise over time; salt and power are usually more predictable.
- On the other side: the time to install and commission, staff training, water pre-treatment, and keeping a registered product for tasks that require label claims.
Buying versus leasing
Buying outright gives the lowest total cost over the life of the system and the fastest payback once running savings start. Leasing spreads the one-off cost into monthly payments, which some operators prefer because the payment can be set against the chemical spend it replaces from the first month. The right answer depends on your capital budget, tax position and how long you expect to run the system; ask your finance team to compare both on the same model.
| Buy outright | Lease | |
|---|---|---|
| Upfront cost | System, installation, storage | Deposit, if any |
| Ongoing cost | Running costs only | Monthly payment plus running costs |
| Cash flow in year one | Negative until payback | Can be positive from month one if the payment is below the saving |
| Total cost over the term | Lowest | Higher, reflecting financing |
Purchase options
Commercial and industrial systems can be bought outright, and deposit or leasing arrangements can be discussed; a lease turns the fixed cost into a monthly payment that can be compared directly with current chemical spend. Choose your preferred path on the quote form.
Let us build the model with you
The free sanitation audit takes your invoices, task list and utility rates, sizes the system, and sends back a written payback model — including when a generator is not the right choice.
Tracking savings after installation
A payback model is a forecast; the savings are real only once they show up in the numbers. Set a baseline before installation using the same twelve months of invoices, then track the same lines each month afterwards: chemical purchases by product, freight, dispenser charges, salt or brine, and any service or filter costs. Read the electricity and water meters, or estimate their share from run hours. Compare the result with the model every quarter.
If savings lag the forecast, the cause is usually one of three things: old products still being bought out of habit, tasks that were never moved across, or a set point higher than the task requires. Each is easy to fix once it is visible. A simple quarterly review keeps the programme honest and gives finance the evidence it needs.
Frequently asked questions
How fast do generators pay back?
It depends entirely on what you spend today and what the system replaces. On Norwegian Cruise Line’s ships the equipment paid back in about 5.5 months; a lower-spend site will take longer. Run the model above with your own numbers, or let the audit do it.
What does a generator cost to run?
Mainly salt or brine, water and electricity, plus filters, service and test consumables. Rates vary by site.
Can I lease instead of buying?
Leasing and deposit terms can be discussed for commercial and industrial systems. Ask on the quote form.
Should I include labour savings?
Yes, but conservatively. Count the time actually spent receiving, storing and diluting chemicals, at your loaded labour rate, and only where that time is genuinely freed for other work.
What if my chemical prices rise?
Rising chemical and freight prices increase A and shorten payback. It is worth running the model at today’s prices and at a modest annual increase to see the range.
Is the example a quotation?
No. The illustrative example uses hypothetical figures to show the method, and the Norwegian Cruise Line example reflects that fleet’s costs. Your quotation and payback model come from the audit.
Do I still need to buy any chemicals?
Usually detergents, and a registered product for any task that requires specific label claims. The model only counts what the generator replaces.